Cortex is a health dashboard that pulls data from WHOOP and Withings into one place. Recovery scores, sleep stages, HRV, strain, weight, body composition, BMR – all of it, charted over time with date range filtering. I built it because I was tired of switching between two apps to understand how my body was doing on any given week.
It's a Next.js 16 app backed by Supabase, with OAuth integrations for both WHOOP and Withings, a cron-based sync system, and 17 interactive charts. I'll break down how the data pipeline works, what the schema looks like, and why some of the decisions ended up the way they did.
Why I Built This
I wear a WHOOP band and I own a Withings scale. Both are amazing health accessories, but they are completely isolated from each other. WHOOP tells me my recovery is low today but can't correlate that with the fact that I gained two kilos over the holidays. Withings tracks my body fat percentage over time but has no idea that my sleep quality tanked last week.
What I wanted was a single screen where I could glance at everything and spot patterns across data sources. Did my HRV drop when my weight went up? Is my sleep performance better in weeks where I'm training harder? These aren't hard questions, but they're impossible to answer when the data lives in two separate apps that don't talk to each other.
So I built the thing that connects them.
The OAuth Dance
Both WHOOP and Withings use OAuth 2.0, but they implement it differently enough to be annoying. WHOOP follows the spec pretty closely: standard authorization code flow, access and refresh tokens, clean JSON responses. Withings wraps everything in a non-standard response body where you check status === 0 to know if the call succeeded, and the actual token data is nested under body.
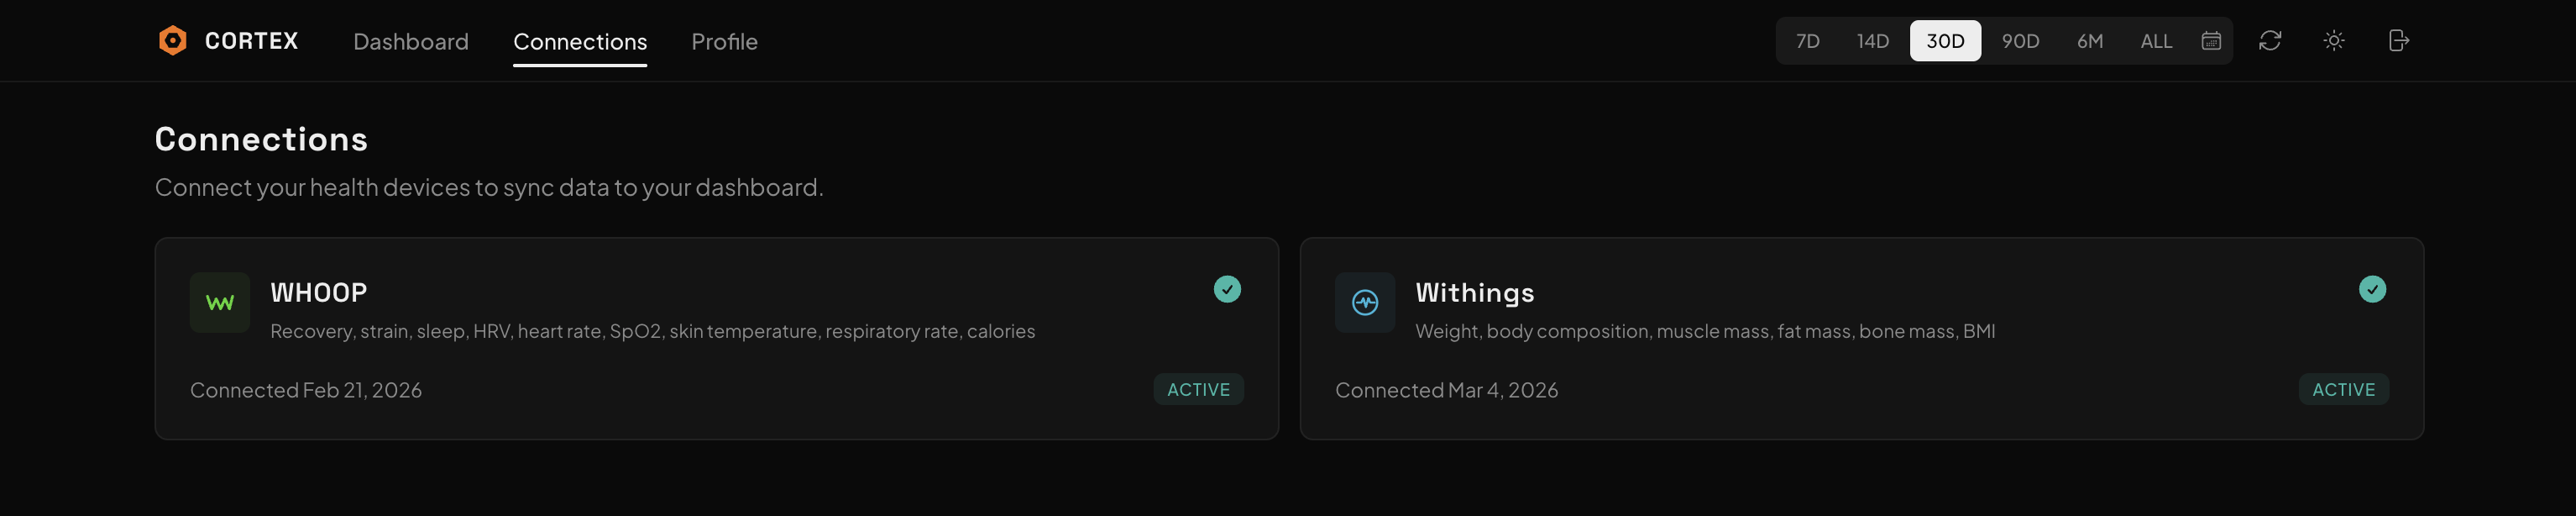
Each provider has a pair of API routes: one to kick off the authorization redirect, one to handle the callback. The callback exchanges the authorization code for tokens, stores them in the oauth_tokens table with a unique constraint on (user_id, provider), and triggers an initial 30-day sync. That last part matters because without it, you'd connect a provider and then stare at an empty dashboard until the next cron run.
Token management is centralized in a single getValidToken function. Every time the app needs to hit an external API, it checks the stored token's expiration. If it expires within five minutes, the function refreshes it proactively, updates the database, and returns the fresh access token. If the refresh fails because the user revoked access, or the token expired on the provider side, it returns null and the sync logs a failure. No half-alive token states, no mystery errors two API calls later.
The Sync Pipeline
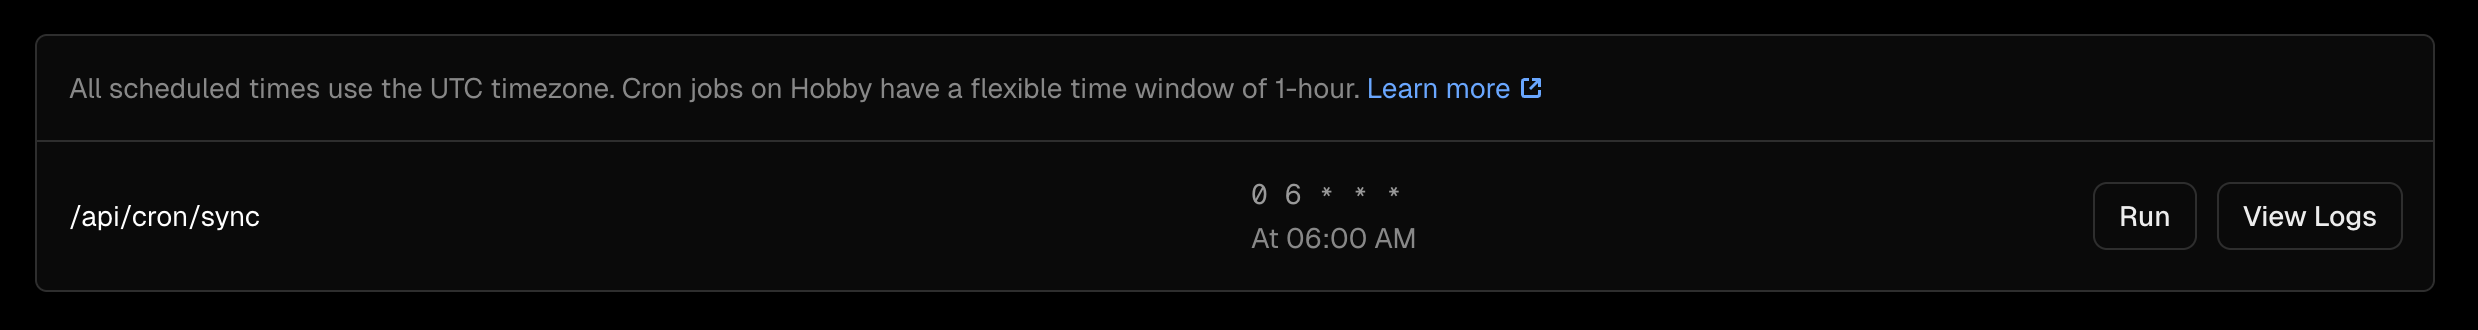
Data gets into Cortex two ways: a Vercel cron that runs daily, and a manual sync button in the header.

The cron route uses a service role Supabase client, pulls every user who has connected a provider from the oauth_tokens table, groups them by user, and syncs all their providers in parallel. Each user's WHOOP and Withings syncs run concurrently. The whole thing finishes in a few seconds even with multiple users.
The WHOOP sync is the heavier one because it touches four data types: cycles (daily strain), recovery (HRV, resting heart rate, SpO2, skin temp), sleep (stages, duration, respiratory rate), and workouts. All four API calls fire in parallel via Promise.all. The results get mapped to database rows and upserted using the onConflict clause on the provider's unique ID. If you sync the same day twice, you get updated data, not duplicates.
The Withings sync is simpler with just one API call for measurements, but the data mapping has more edge cases. BMI, for instance. Withings sometimes sends it directly. Sometimes it doesn't. When it doesn't, the sync function falls back to calculating it from weight and the most recent height measurement. If there's no height measurement at all, it checks the user's profile for a manually entered height. Three-tier fallback. Same story for BMR: if we have weight, height, age, and gender, we calculate it using the Mifflin-St Jeor equation. If any of those are missing, the field stays null.
Incremental sync was the part that bit me. Initially, the sync used the exact completed_at timestamp from the last successful sync as the start date for the next one. Problem is, Withings measurements don't always appear in their API the instant you step on the scale. There's a processing delay. So if you weigh yourself at 7:58 AM and the sync ran at 8:00 AM, the measurement might not exist yet. Next sync starts at 8:00 AM and misses it entirely. The fix was a one-hour overlap buffer on the start date. The upsert's onConflict clause handles the duplicates, so the buffer costs nothing.
The Database
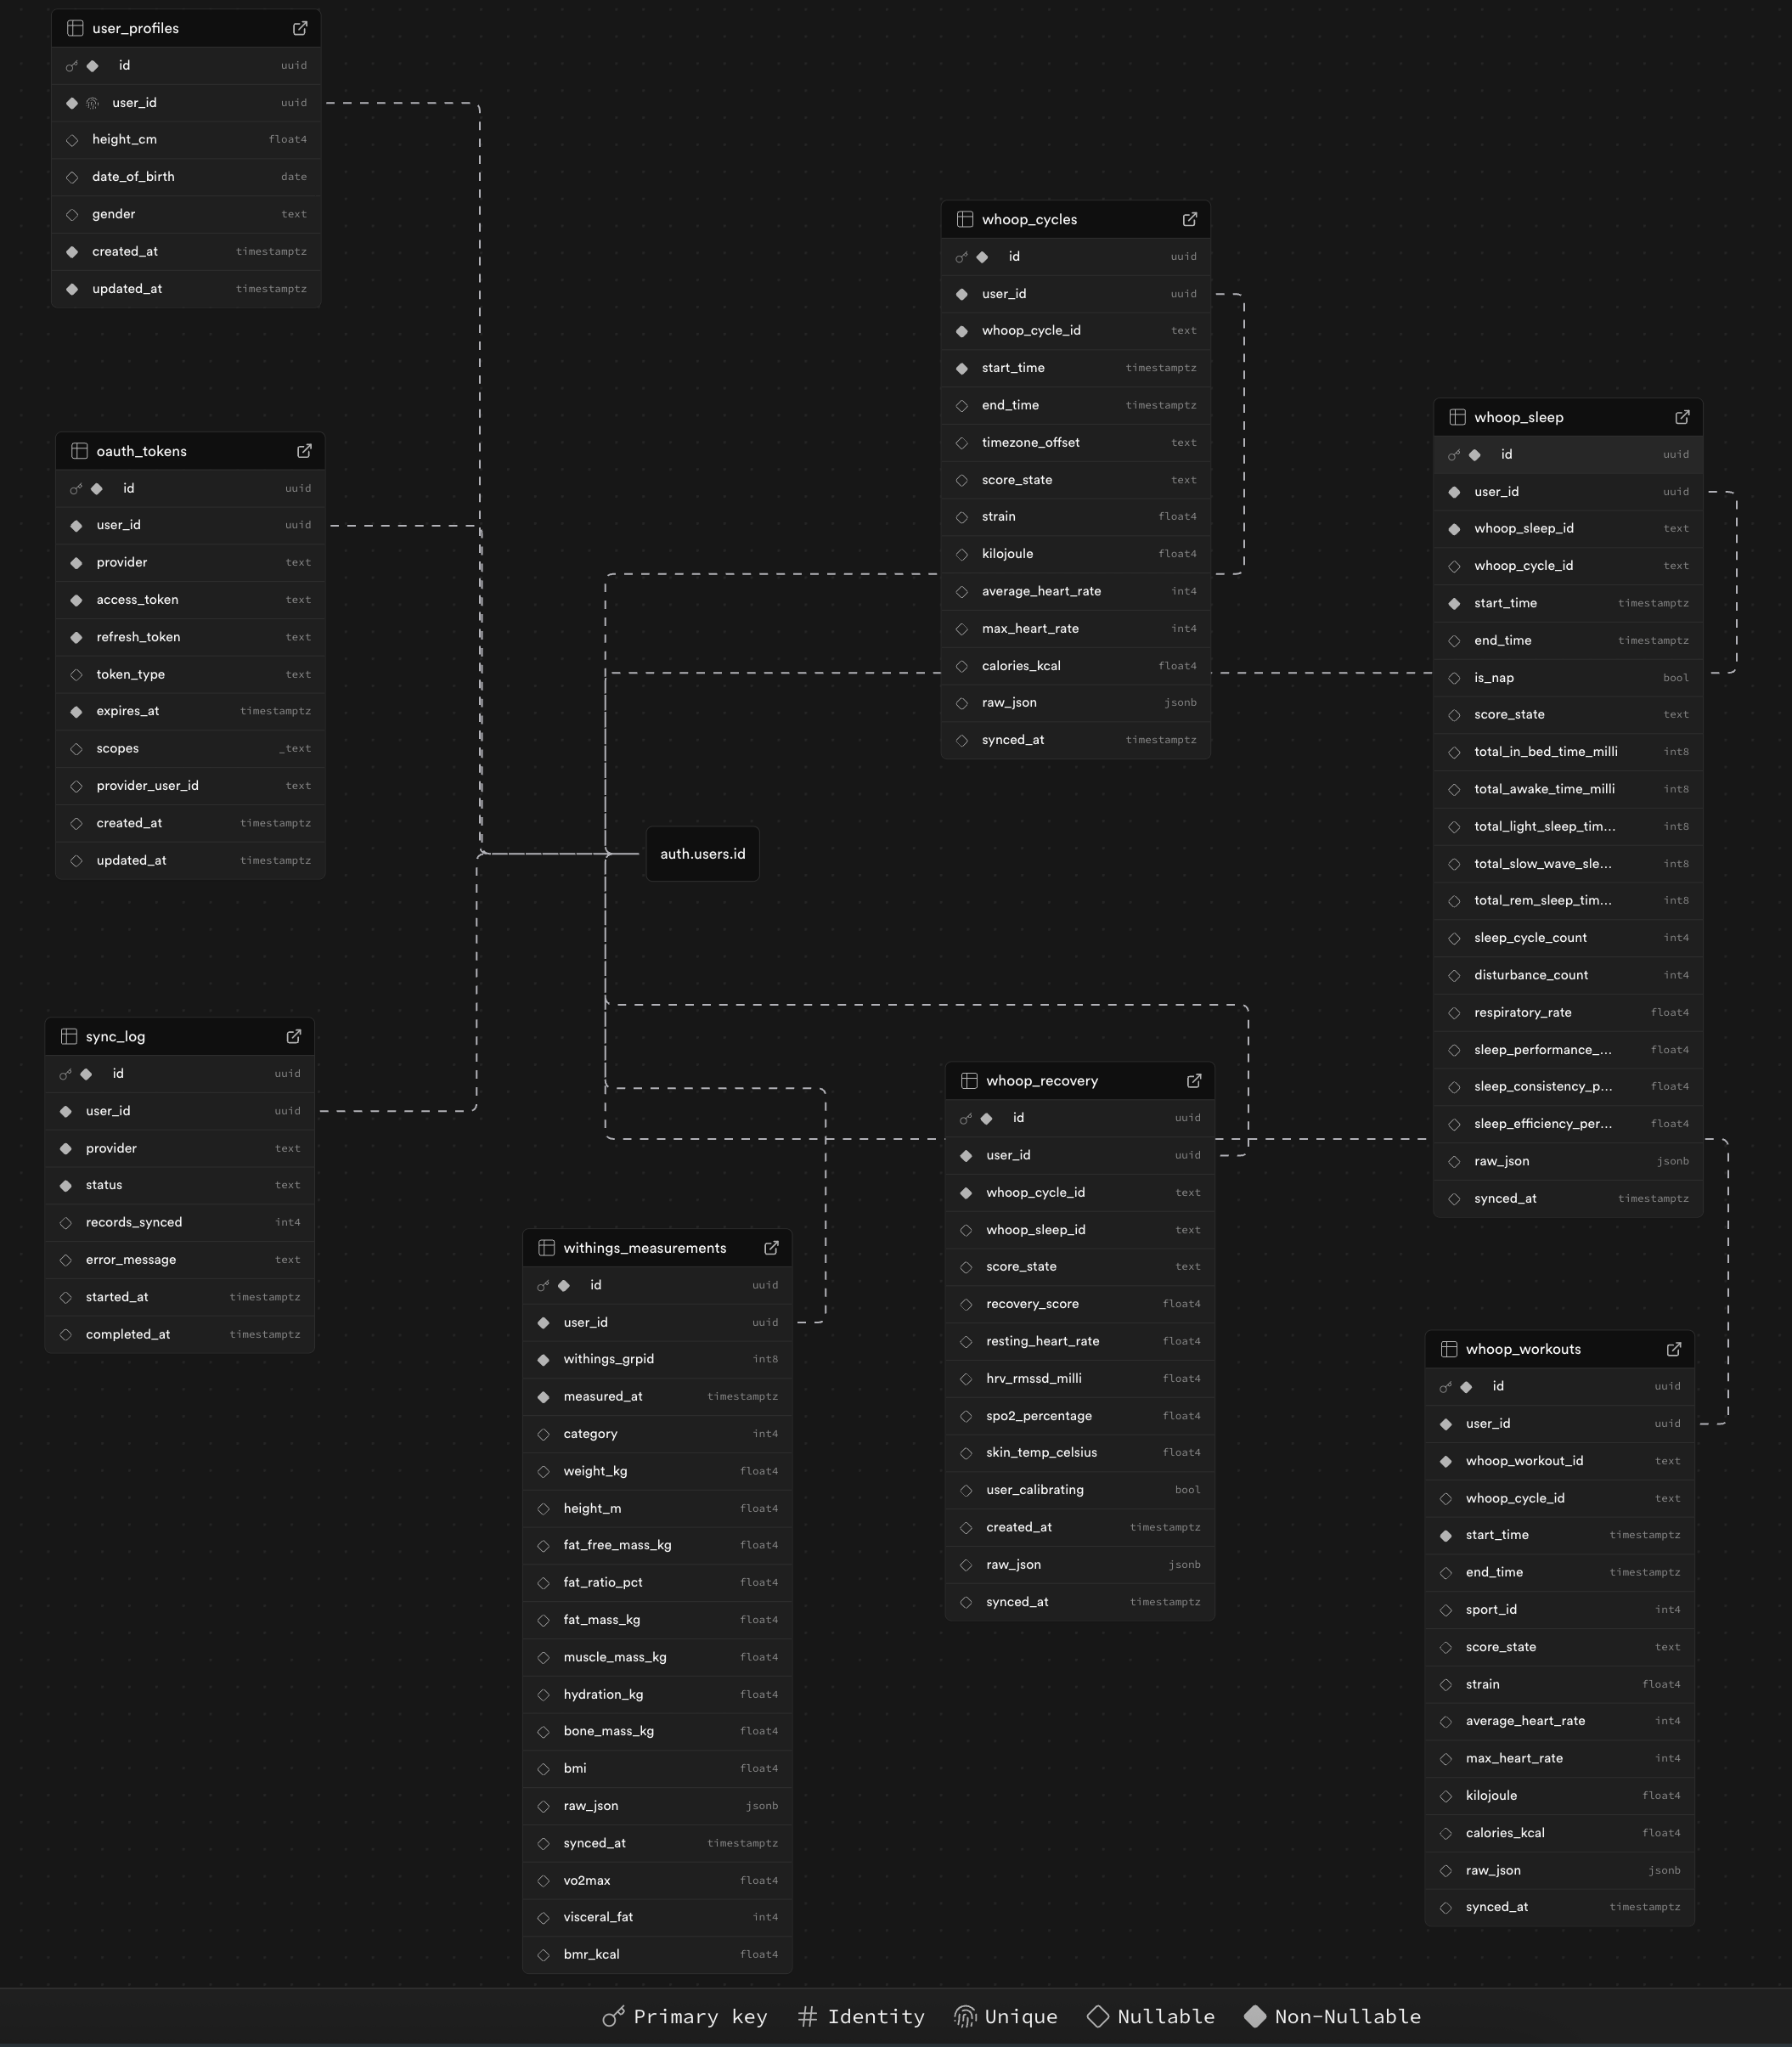
PostgreSQL on Supabase. Seven tables across three migrations.
The first migration created the core schema: oauth_tokens for provider credentials, four WHOOP tables (whoop_cycles, whoop_recovery, whoop_sleep, whoop_workouts), withings_measurements for body data, and sync_log for tracking every sync attempt. Each WHOOP table is keyed on (user_id, whoop_*_id) so upserts work cleanly. Every table has an index on (user_id, timestamp DESC) because every query in the app filters by user and sorts by date.
Migration two was pure RLS. Every table gets the same policy: auth.uid() = user_id for all operations. No custom API layer, no middleware authorization checks. Supabase's PostgREST handles the data access and RLS is the security boundary. For a personal app this is the right amount of backend infrastructure: as little as possible.
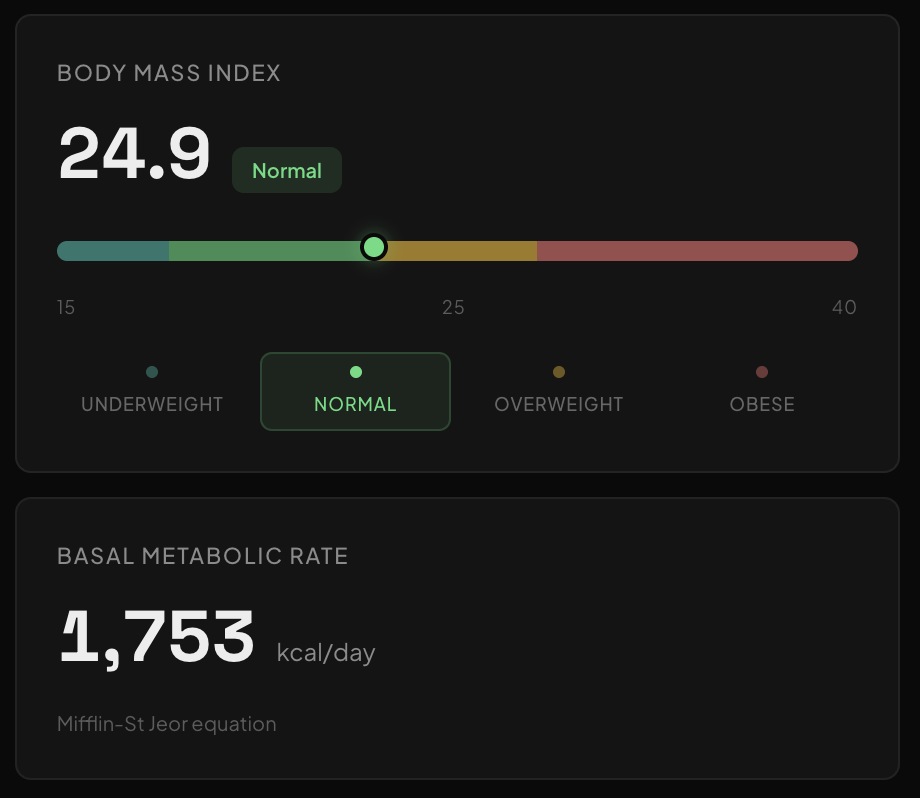
Migration three came after I started actually using the app. I'd connected Withings, saw my weight chart, and immediately wondered what my BMI was. Withings sometimes sends it, sometimes doesn't. But to calculate it you need height, and height wasn't in the schema. I also wanted BMR (basal metabolic rate), which needs height, age, and gender. So I added a user_profiles table for height, date of birth, and gender, plus three new columns on withings_measurements: vo2max, visceral_fat, and bmr_kcal.
The Dashboard
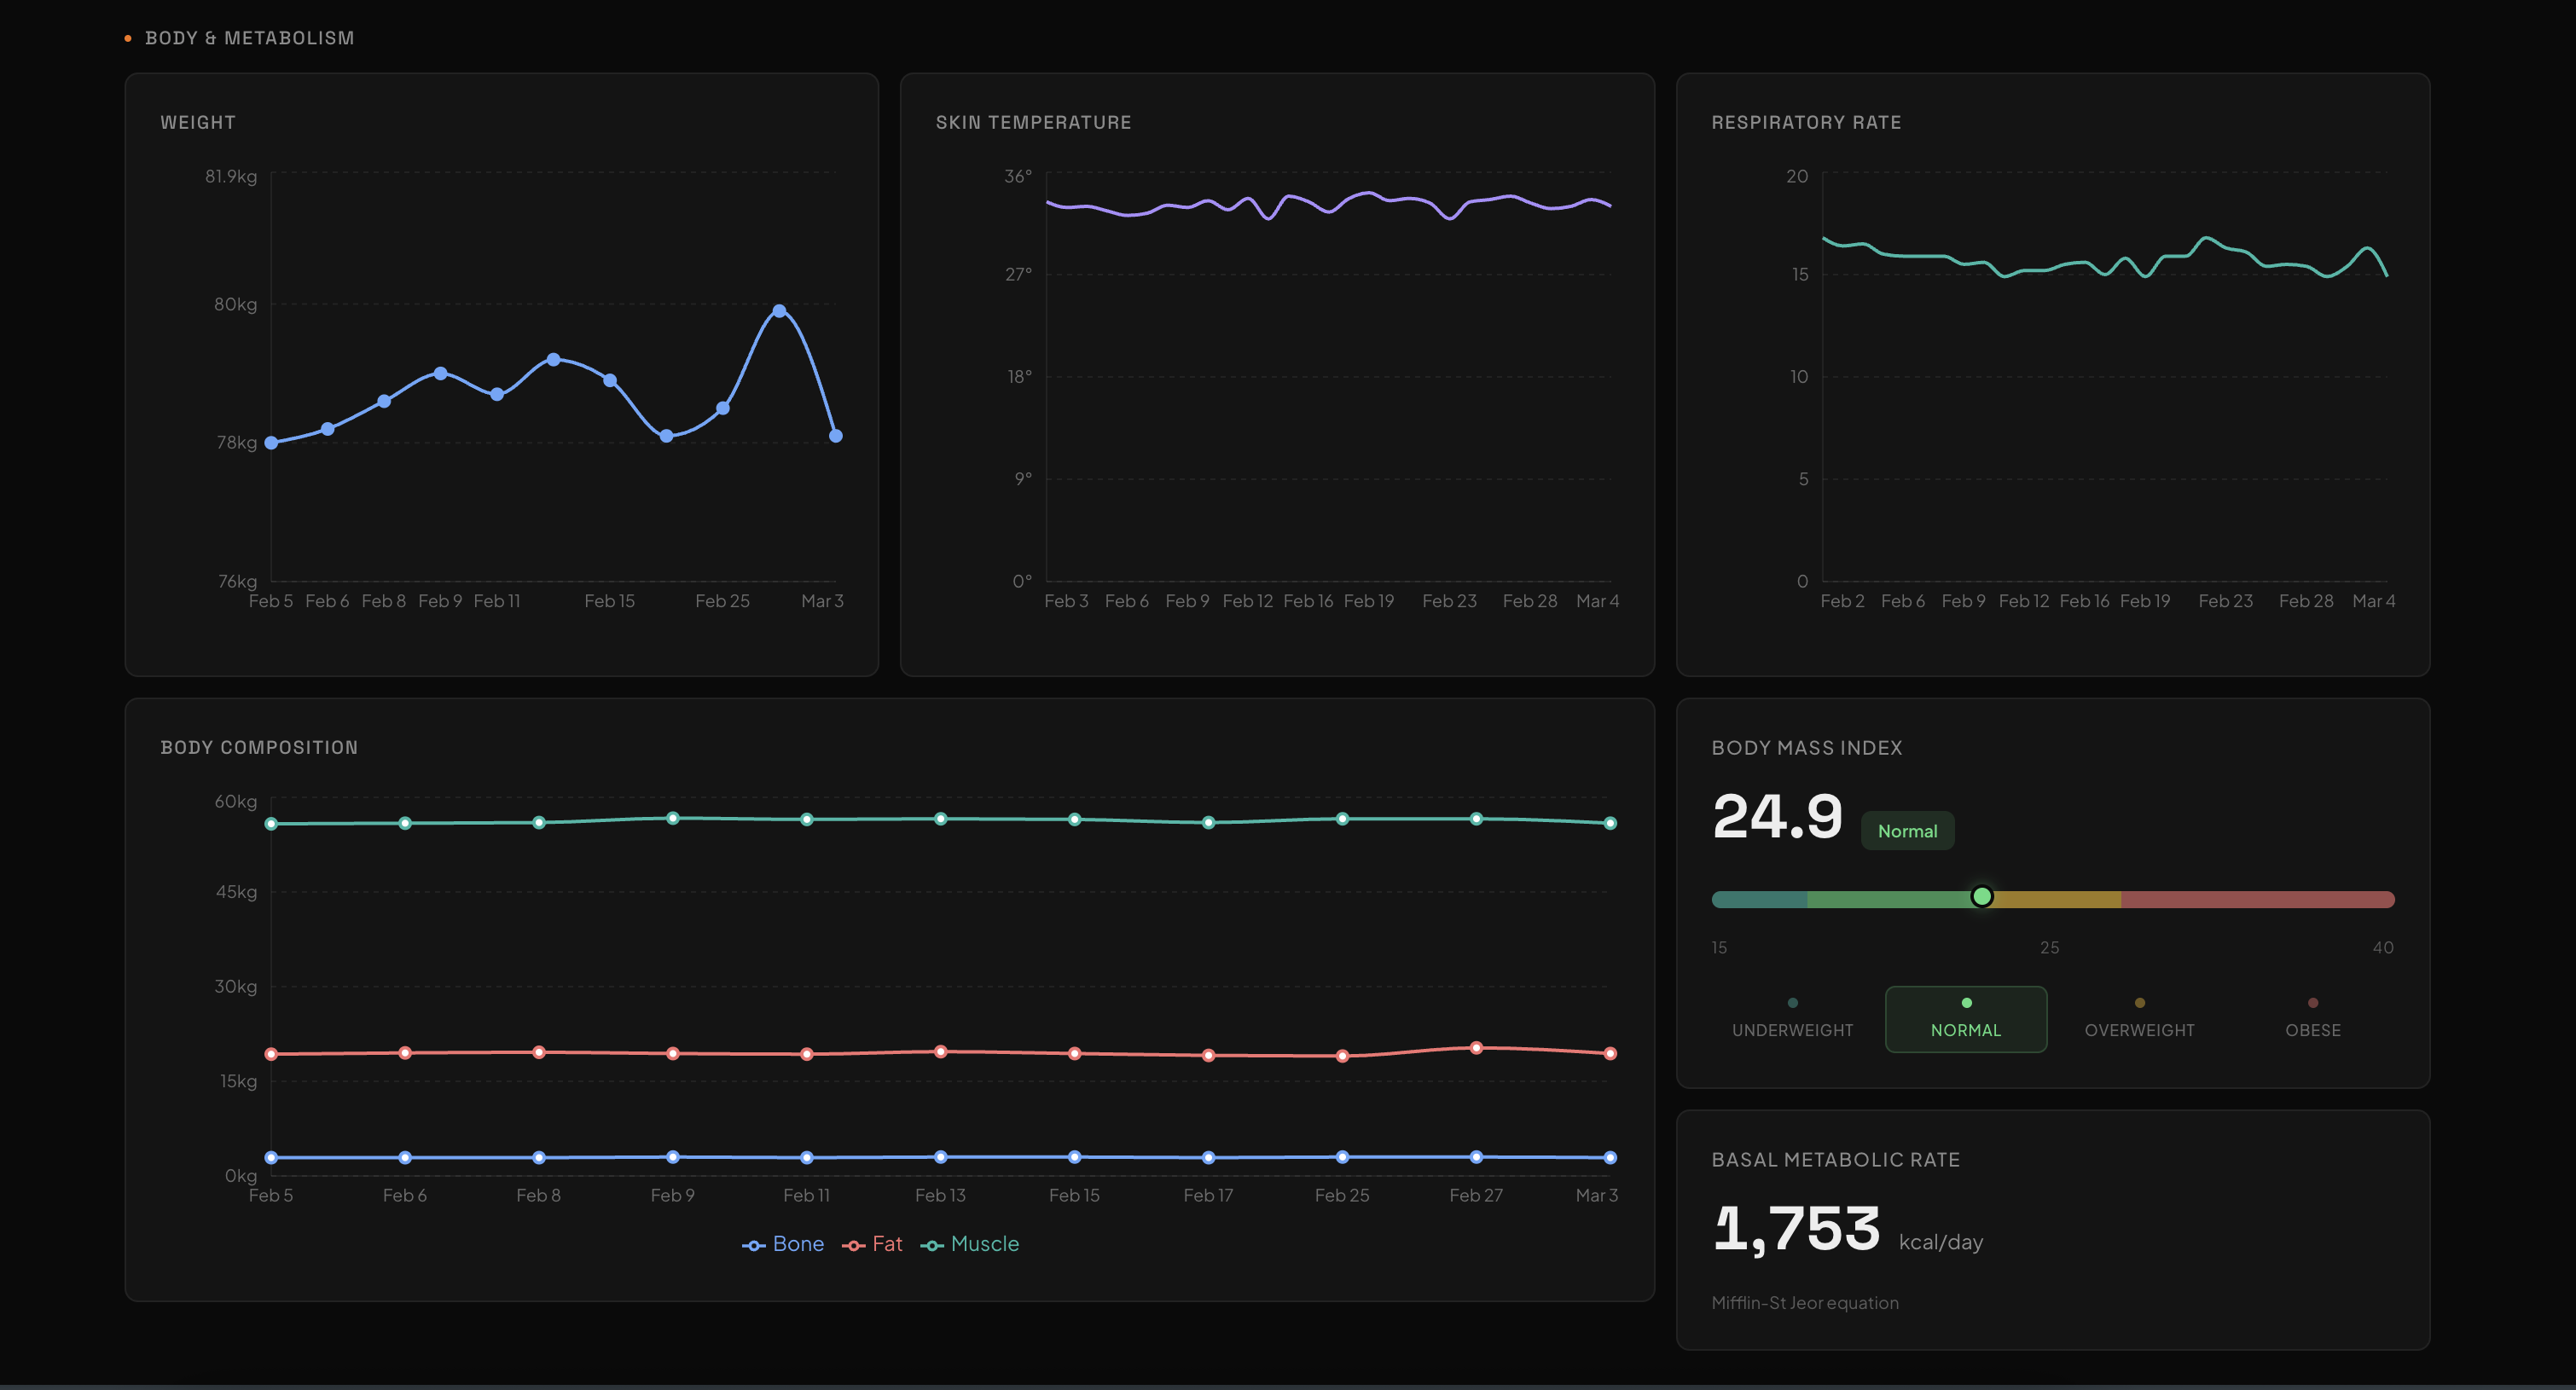
The dashboard is one page with five sections: Recovery & Vitals, Sleep, Activity & Strain, Workouts, and Body & Metabolism. Seventeen chart components total, all built with Recharts.
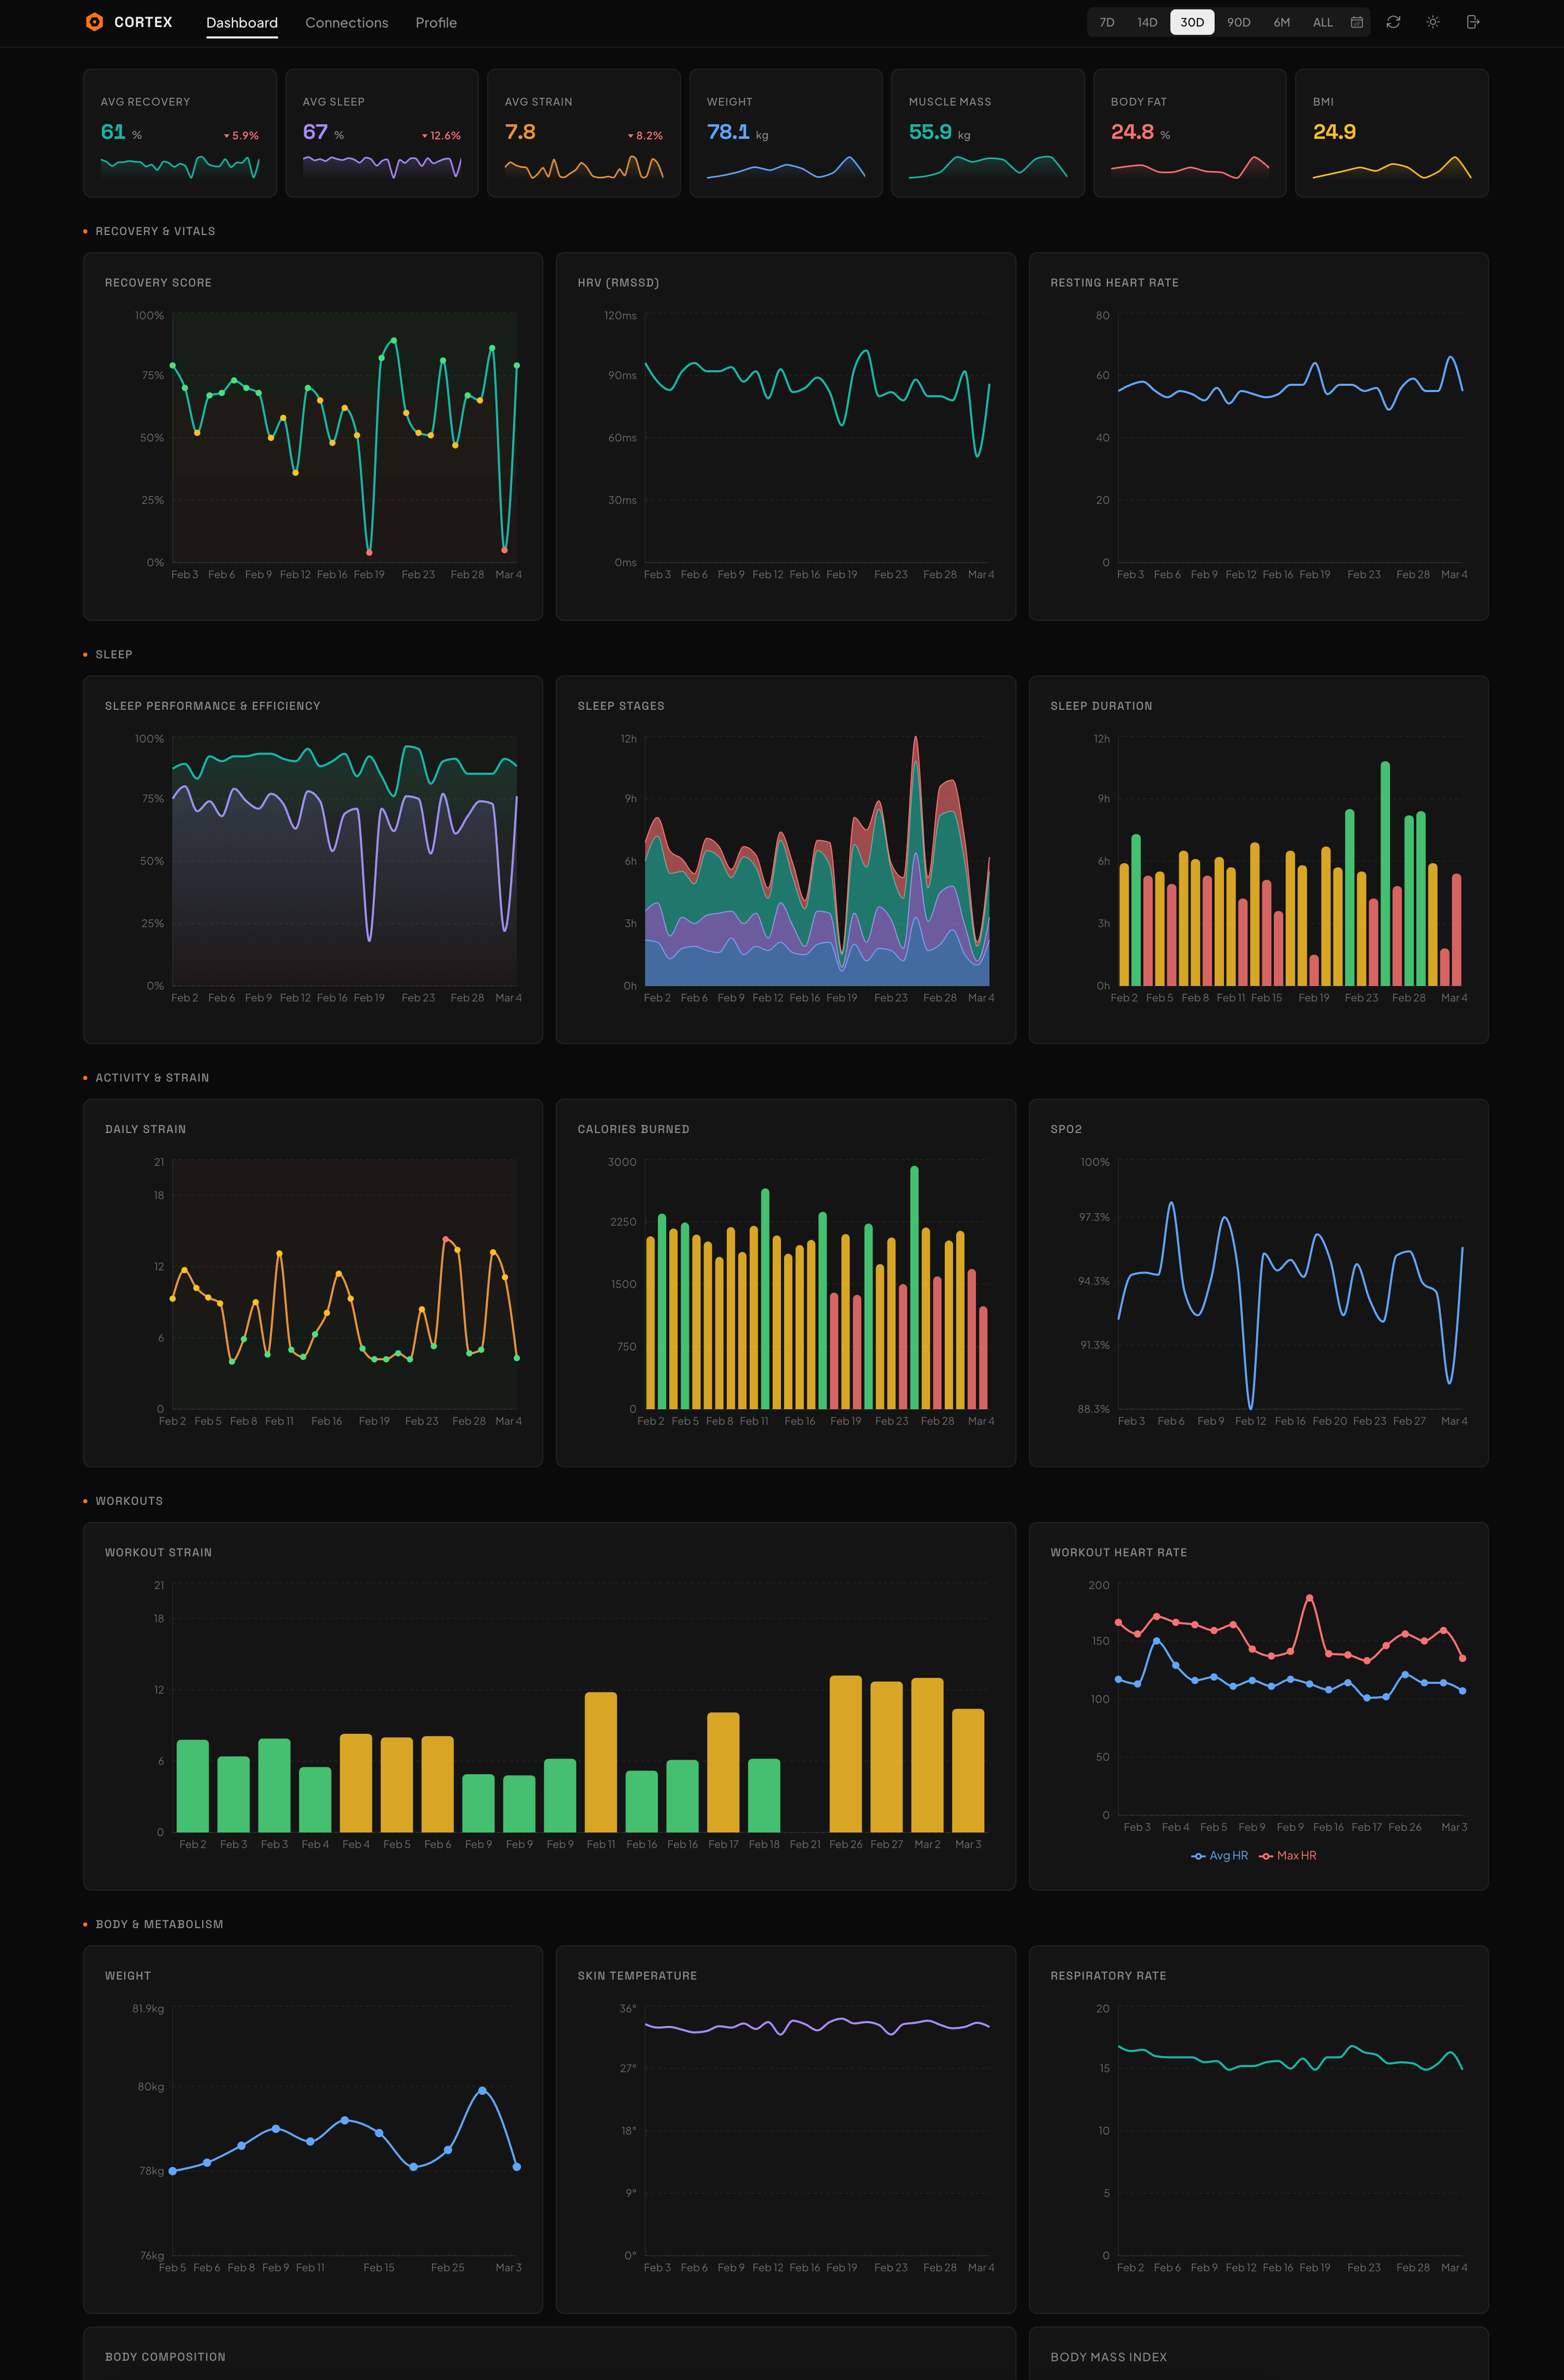
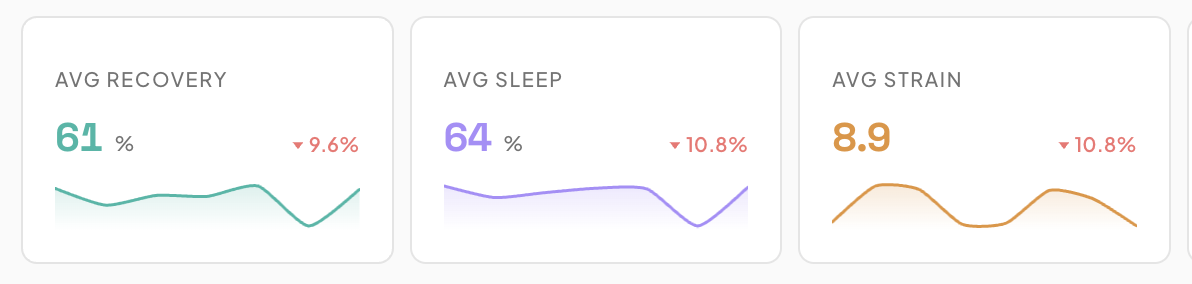
At the top is a summary strip: seven metric cards showing average recovery, average sleep performance, average strain, latest weight, latest muscle mass, latest body fat, and BMI. Each card has a sparkline and a trend indicator. The trend splits the data in half, compares the averages, and shows the percentage change with an arrow. Some metrics invert the direction. Weight going down is green and not red.
Every chart and metric card is wired to the same date range, managed by a Zustand store. Six preset ranges (7D, 14D, 30D, 90D, 6M, ALL) plus a custom date picker. Changing the range updates the store, which invalidates the React Query cache keys, which triggers fresh API calls for the new window. The selected range persists in localStorage so it survives page reloads.
Data fetching uses four React Query hooks. One each for recovery, sleep, cycles, and workouts from WHOOP, plus one for Withings measurements. The query key includes the date range label, so switching from 7D to 30D doesn't serve stale data from cache. The hooks all follow the same pattern: read the date range from the Zustand store, build query params, hit the API route, return typed data.
The Sync Log
The sync_log table tracks every sync attempt: provider, status (started/completed/failed), records synced, error message, timestamps. This was originally just for debugging, but it turned out to be the backbone of the incremental sync logic. Every sync looks at the last completed entry to decide where to start fetching from.
Early on, the Withings sync had a bug where it would return early on invalid tokens before inserting a sync log entry. So if your token expired, there was no record that a sync was even attempted. The next sync would still look at the old completed_at timestamp and think everything was fine. I fixed this by moving the log insert to the very first line of the function, before the token check. Now every invocation leaves a trace, successful or not.
Design
Dark mode by default. #0a0a0a background, #141414 card surfaces, subtle borders at 6% white opacity. Light mode flips to #fafafa with white cards. The accent color is orange (#f97316) because it pops against both dark and light backgrounds without being obnoxious.
Typography is Space Grotesk for headings and Plus Jakarta Sans for body text. Section headers are 11px uppercase with 0.08em letter spacing and a small orange dot before the label. The whole thing reads like a monitoring dashboard, which is exactly what it is.
Charts use a seven-color palette: teal, orange, purple, blue, red, amber, green. Each metric type gets its own color consistently across every chart it appears in. Recovery is always teal. Sleep is always purple. Strain is always orange. You never have to check the legend to know what you're looking at.
The sparklines in the summary strip deserved some attention. They use a custom SVG renderer with Catmull-Rom spline interpolation for smooth curves, plus a gradient fill that fades from the line color to transparent. They animate on load with a stroke-dashoffset trick for the line draw and an opacity fade for the fill. Small touch, but it makes the page feel alive when you first open it.
Accessibility was baked in. Every summary card has an aria-label with the metric name and current value. The BMI gauge has a role of img with a description. Section headers have IDs for anchor linking. There's a skip-to-content link for keyboard navigation. And the entire animation system respects prefers-reduced-motion — if you have it enabled, every animation duration drops to near-zero.
Things I'd Change
The raw JSON storage is doing double duty as both an archival strategy and a lazy schema extension mechanism. It works, but querying into JSONB columns is slower than proper typed columns. If I add more metrics from the raw data, I should probably backfill and add proper columns rather than relying on JSON extraction at query time.
I'd also add webhook support for Withings. Right now the sync is pull-based: cron job or manual trigger. Withings supports notification webhooks that fire when new measurements are available. That would eliminate the staleness problem entirely and remove the need for the threshold-based sync trigger in the data route.
The chart components could be more composable. Right now each of the 17 charts is its own file with its own Recharts configuration. There's a lot of repeated boilerplate — tooltip setup, axis formatting, responsive containers. A generic chart wrapper that takes a config object would cut the code in half, but I haven't hit the point where the repetition is painful enough to refactor.
Outcome
Cortex is deployed on Vercel, syncing daily via cron, with real-time manual sync when I want it. Seven summary metrics with sparklines, 17 interactive charts across five categories, full dark/light mode, date range filtering from 7 days to all time, and a profile page for filling in the data gaps that the APIs don't cover.
The thing that actually made it useful was seeing the data side by side. Recovery score next to body weight next to sleep stages, all on the same timeline. The patterns become obvious when the data isn't siloed. My recovery consistently drops when my body fat ticks up. My sleep performance correlates with training strain from two days prior, not one. You can't see any of this in the individual apps. You need the full picture, in one place, over time. That's what Cortex is.
Tech Stack: Next.js 16 · React 19 · TypeScript · Supabase · PostgreSQL · Recharts · Zustand · TanStack React Query · Tailwind CSS 4 · Vercel cron jobs · WHOOP API · Withings API